Data Visualization
Visualize PQ Data and PQ Data Analysis Results.

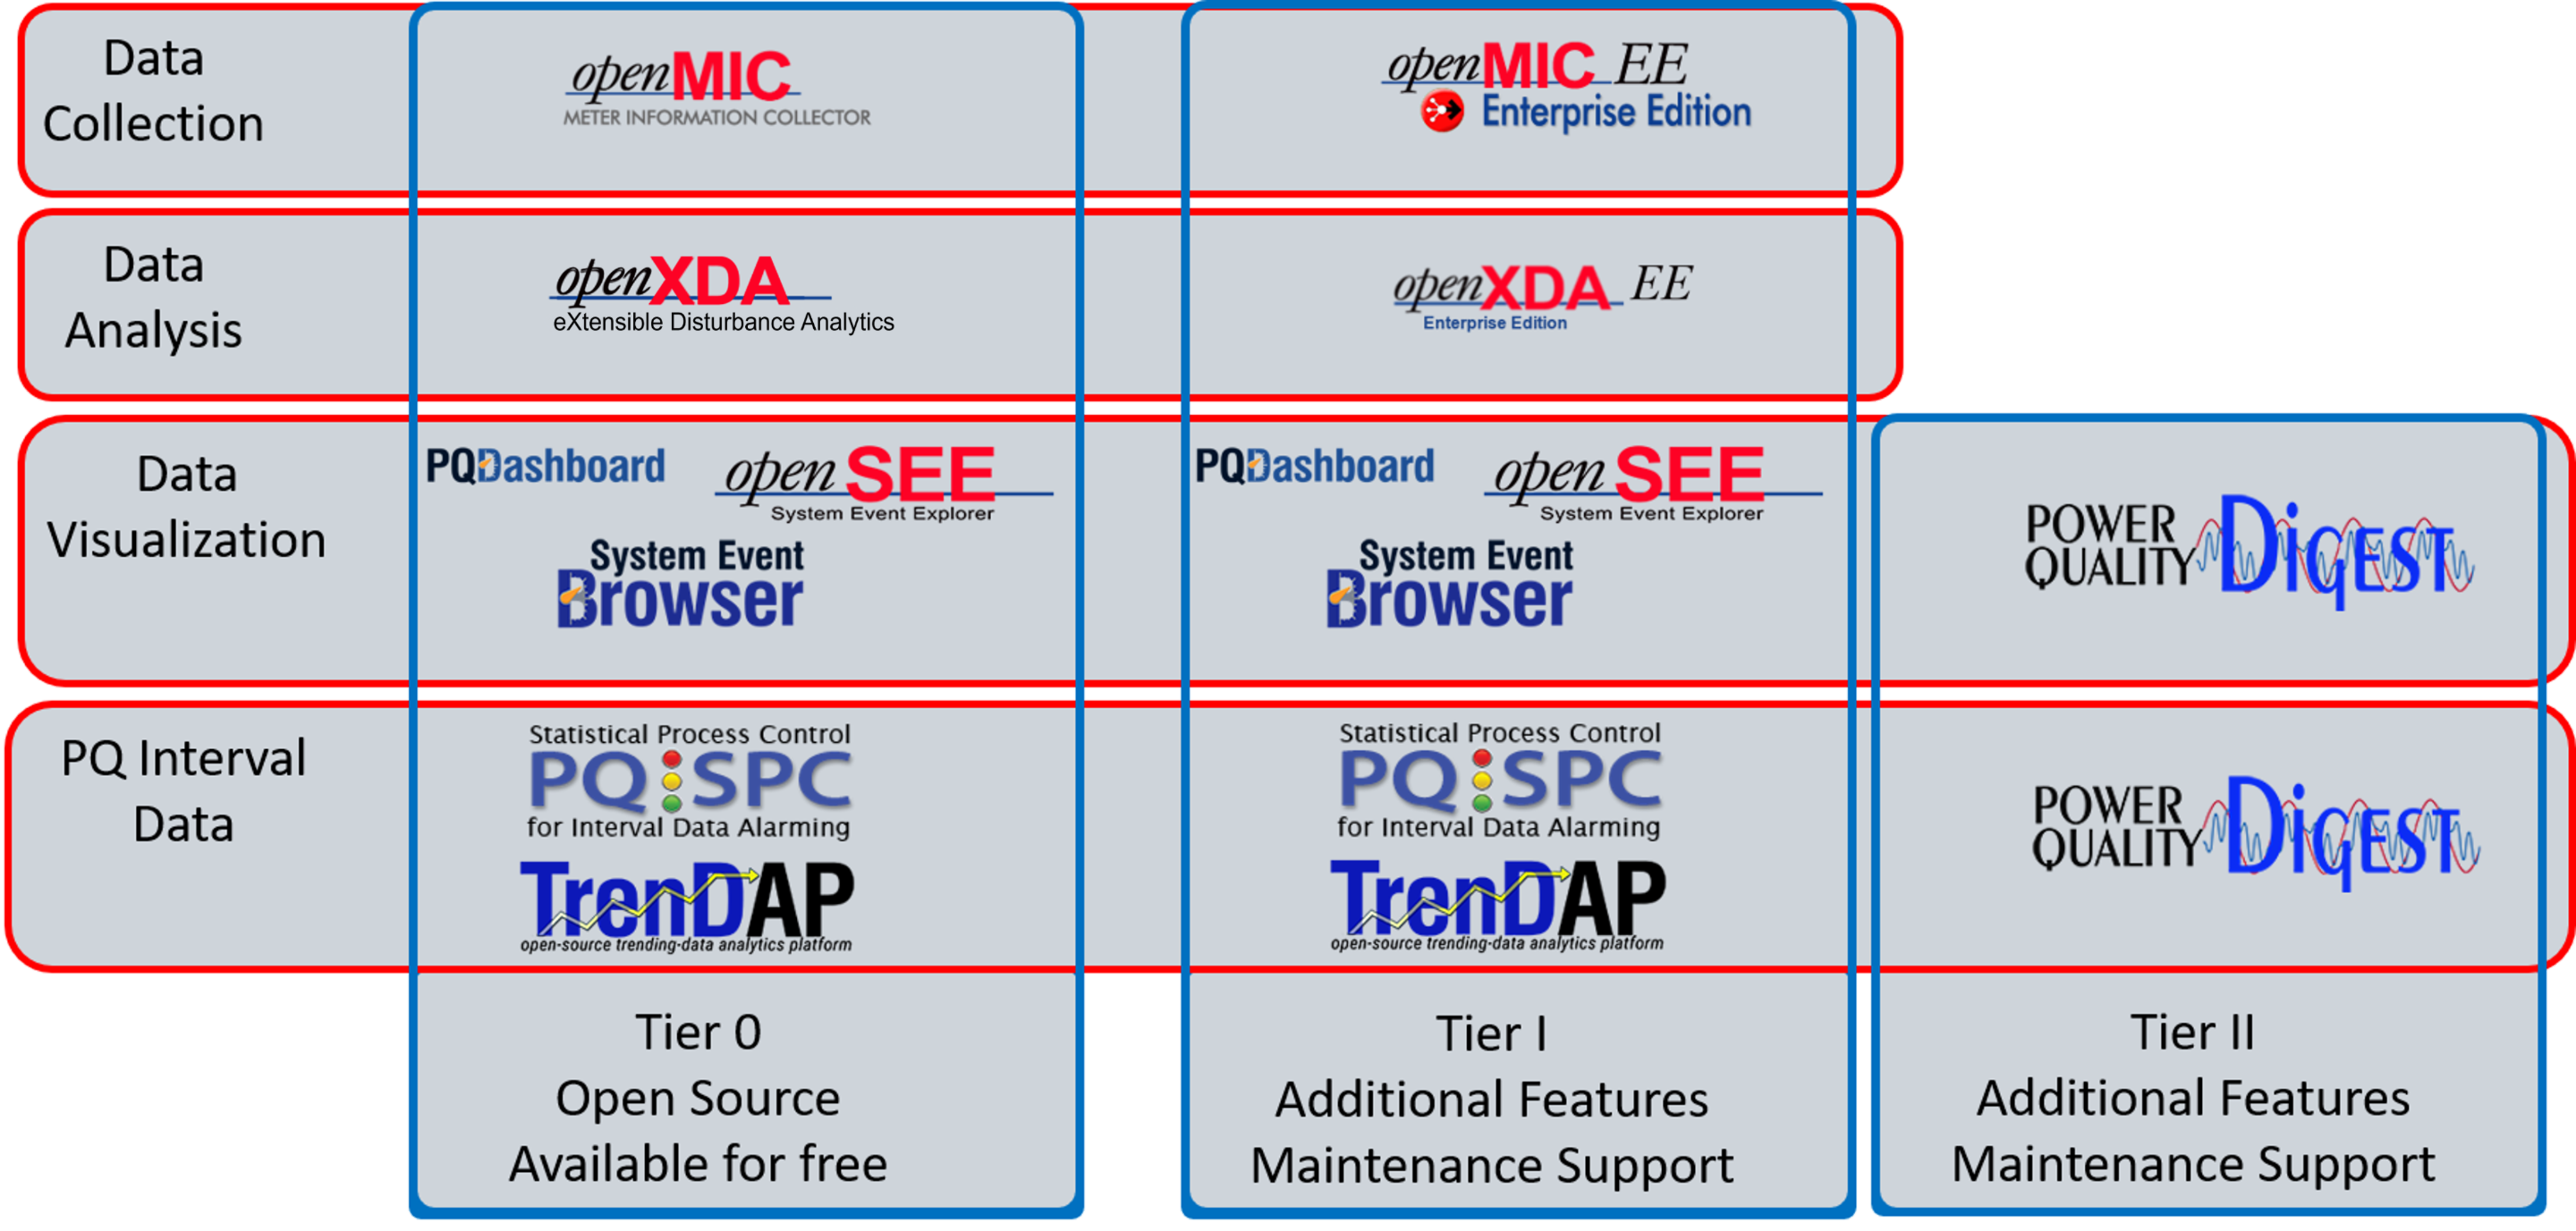
- PQ Dashboard - for quick and simple visualization of disturbances
- SEBrowser - for quick studies and summary information of all relevant data
- openSEE - for detailed waveform analysis and full PQ data visualization
- PQDigest - for external Stakeholder access to PQ data and specific analysis results
- Community Support
- Dedicated support
- Dedicated 24x7 Support Available
- PQ Dashboard - for quick and simple visualization of disturbances
- SEBrowser - for quick studies and summary information of all relevant data
- openSEE - for detailed waveform analysis and full PQ data visualization
- PQDigest - for external Stakeholder access to PQ data and specific analysis results
- Community Support
- Dedicated 8x5 Business Day Support
- Dedicated 24x7 Support Available

PQ Dashboard
The PQ Dashboard is a web-based, enterprise information center for disturbance data. It provides displays to quickly find and understand disturbances on the electric system. The PQ Dashboard is the visualization layer for data processed by the openXDA.
PQ Dashboard displays include the choice of a geospatial map-view or an annunciator panel that provides across-the-room viewing fit for a PQ operations center. Drilling down into from these high-level views provides increasing summary detail information to guide the user down to the specific disturbance waveform of interest.
PQ Dashboard includes a series of tabs that can be individually enabled at either the corporate or user level to provide various dimensions of information derived from disturbance and power quality data. The Dashboard tabs include information on voltage disturbances, faults, breaker operations, data quality, among others.
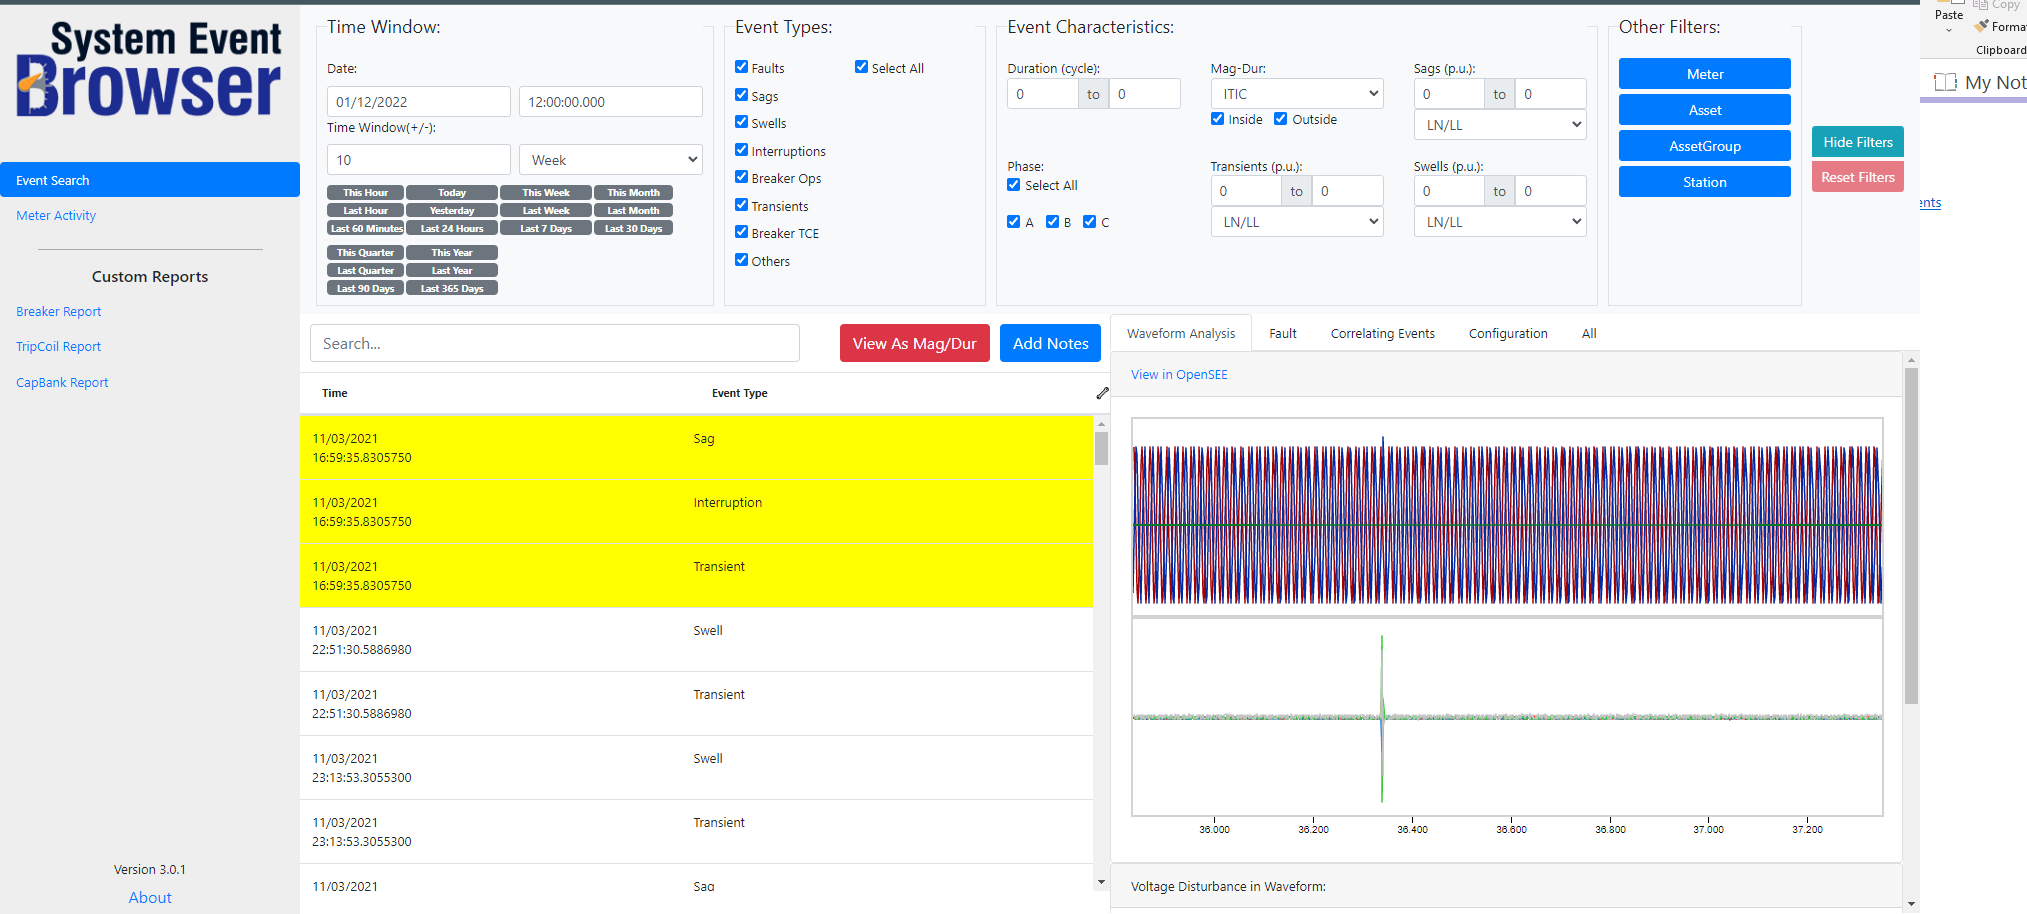
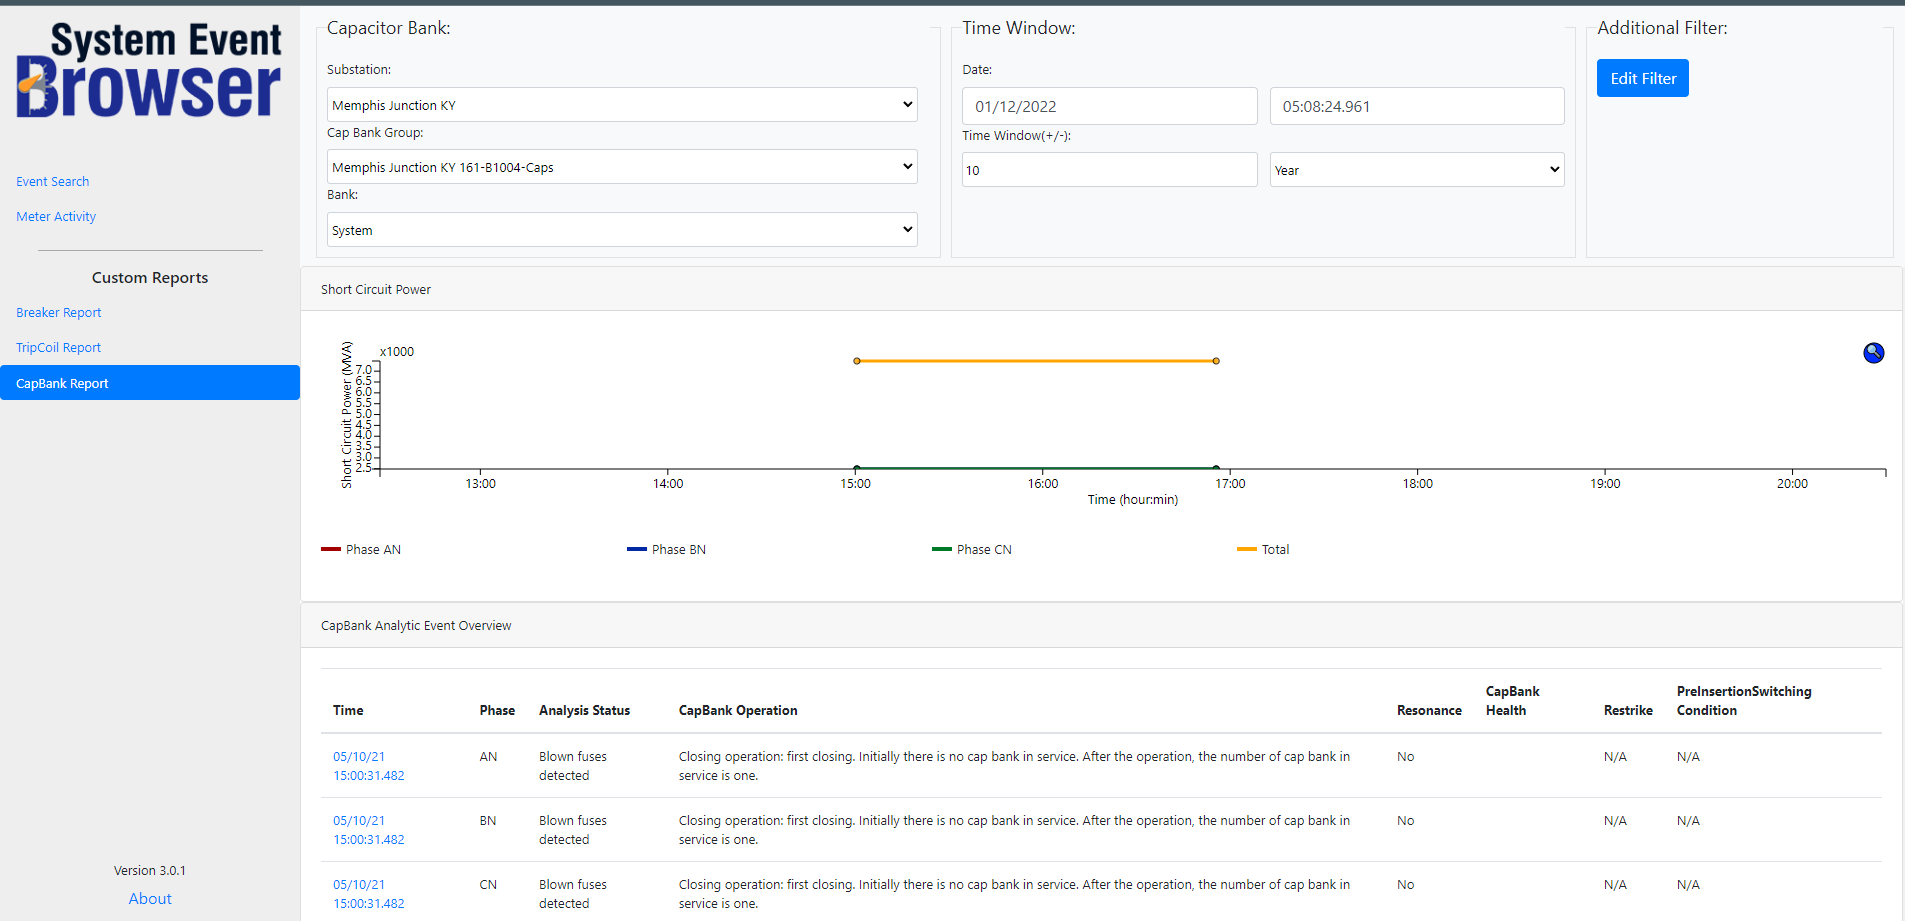
SE Browser
For Power Quality SMEs, GPA has developed the "System Event Browser". With functionality similar to an email client, SE Browser is a browser-based tool that can be used to quickly find recent or historical events of interest, preview the nature of these events and the openXDA analytic findings about them, and then drill in and use GPA's other tools to perform ad-hoc analysis to investigate or study the event in greater detail. SE Browser functionality is "URL Driven" so that utility users can copy and share SE Browser links with one another and be assured that those receiving the link will see exactly what was being viewed by the sender.
The list-based SE Browser is designed to complement the PQ Dashboard which provides graphical methods to filter and drill into event data. Items shown in the SE Browser preview panel include: fault location maps and waveform visualizations among other event summary data.


openSEE
openSEE is a browser-based waveform display tool that can be used to view waveforms and investigate events. openSEE is URL-driven so that a link to openSEE can be embedded in emails to enable recipients to view the same openSEE display -- with the same zoom level and analytic selected -- as seen by the sender.
openSEE can display multiple waveforms simultaneously. A phasor data windows is also available so that users can easily resolve phase angles.
Forward and back buttons in openSEE enable the user to move to previous and subsequent events from the device that recorded the waveform -- or the user can move to previous or subsequent events from any DFR or PQ Meter. This functionality allows the users to quickly see events that happened at about the same time on the power system.
openSEE also supports a number of ad-hoc analytics such as:
- First Derivative
- Clipped Waveform Recovery
- Frequency Computation
- High Pass Filters
- Low Pass Filters
- Missing Voltage Recovery
- Overlapping Waveform Analysis
- Power Computations
- Rectifier Output Analysis
- Rapid Voltage Change Analysis
- Remove Current
- Specified Harmonic Analysis
- Symmetrical Component Analysis
- THD Computation
- Unbalance Analysis
- Fault Distance Estimation
- FFT Analysis
PQ Digest
The PQ Digest application allows utilities to share power quality data with customers and stakeholders. In concept an "SE Browser Lite", the PQ Digest is designed for installation on a utility's externally facing web server to allow external users to have access to summary information about their power quality.
PQ Digest enables customers to view both event and trending data from PQ devices. In addition, it provides information on lightning strikes based on data from a utility's lightning data service.

openXDA 3.0 Suite of Tools
PQ Dashboard, SE Browser, openSEE and PQ Digest are available as part of the openXDA suite of tools. These applications support data visualization for PQ Data and Data Analysis.
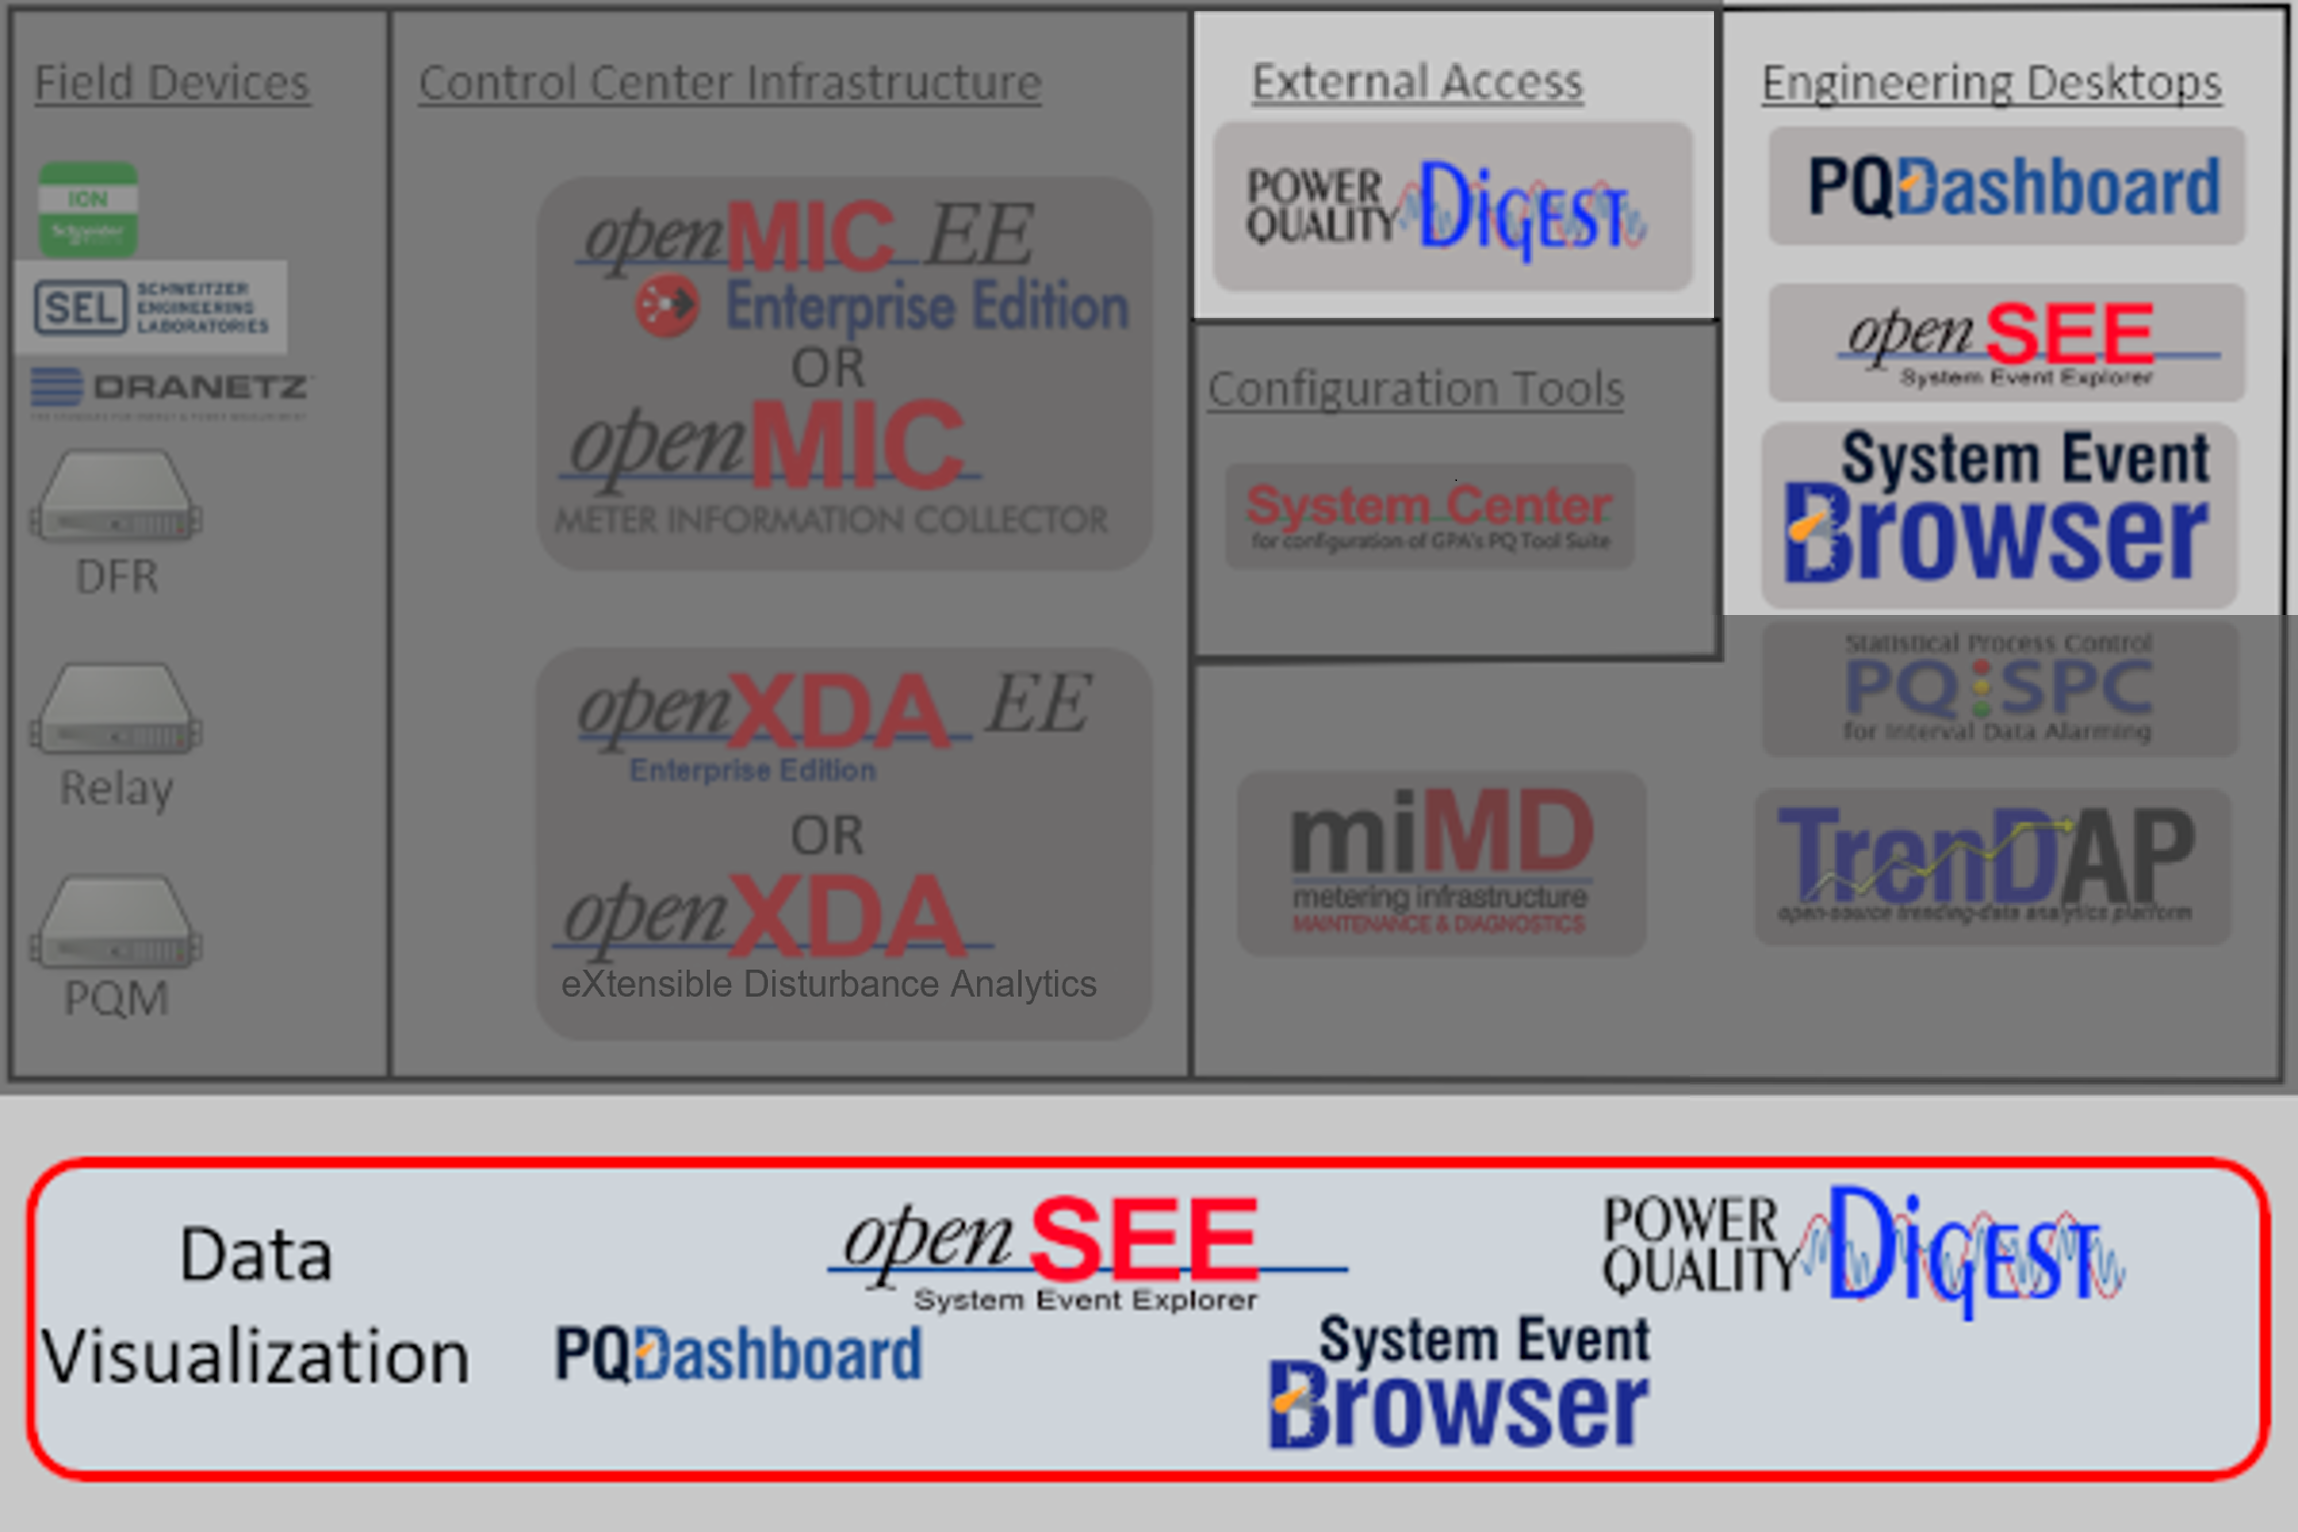
Data Visualization
GPA's data visualization tools allow you to view and analyze your PQ data when and how you need to. With our Enterprise options and PQ Digest, you can share energy usage insights with stakeholders and customers.
PQ Dashboard
PQ Dashboard is the visualization layer for for data processed by openXDA.
SE Browser
SE Browser's list-view is designed to complement PQ Dashboard's graphical views.
SE Browser
SE Browser's list-view is designed to complement PQ Dashboard's graphical views.
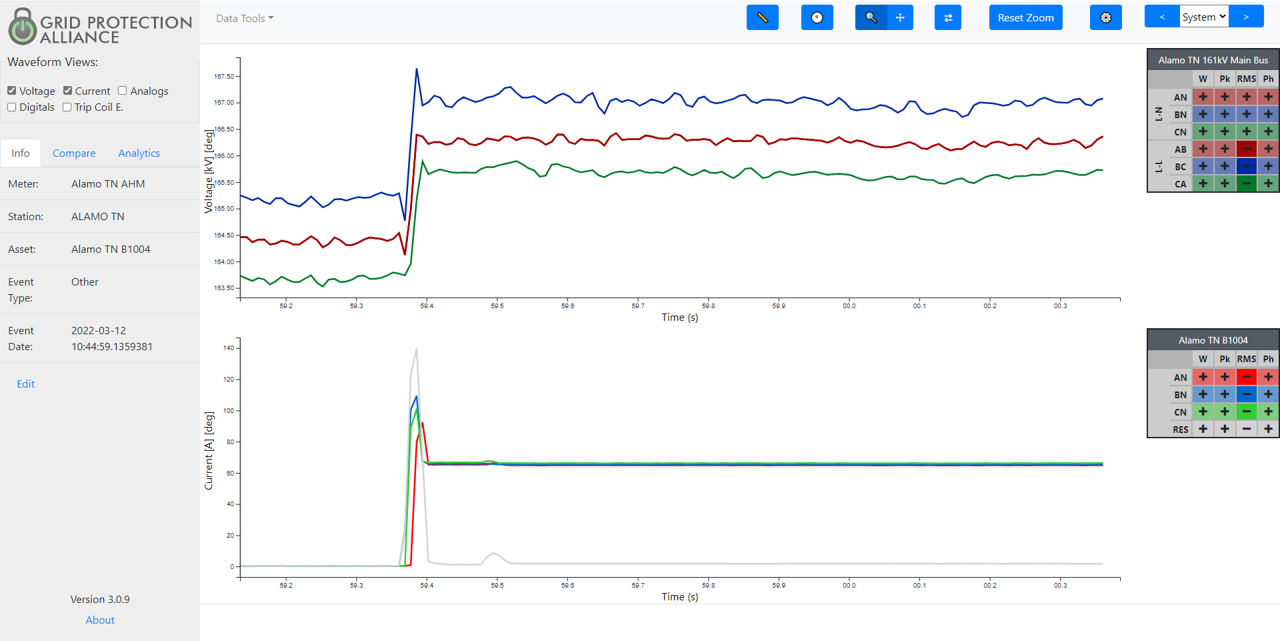
openSEE
openSEE is a view and ad hoc analytics tool for event waveforms.
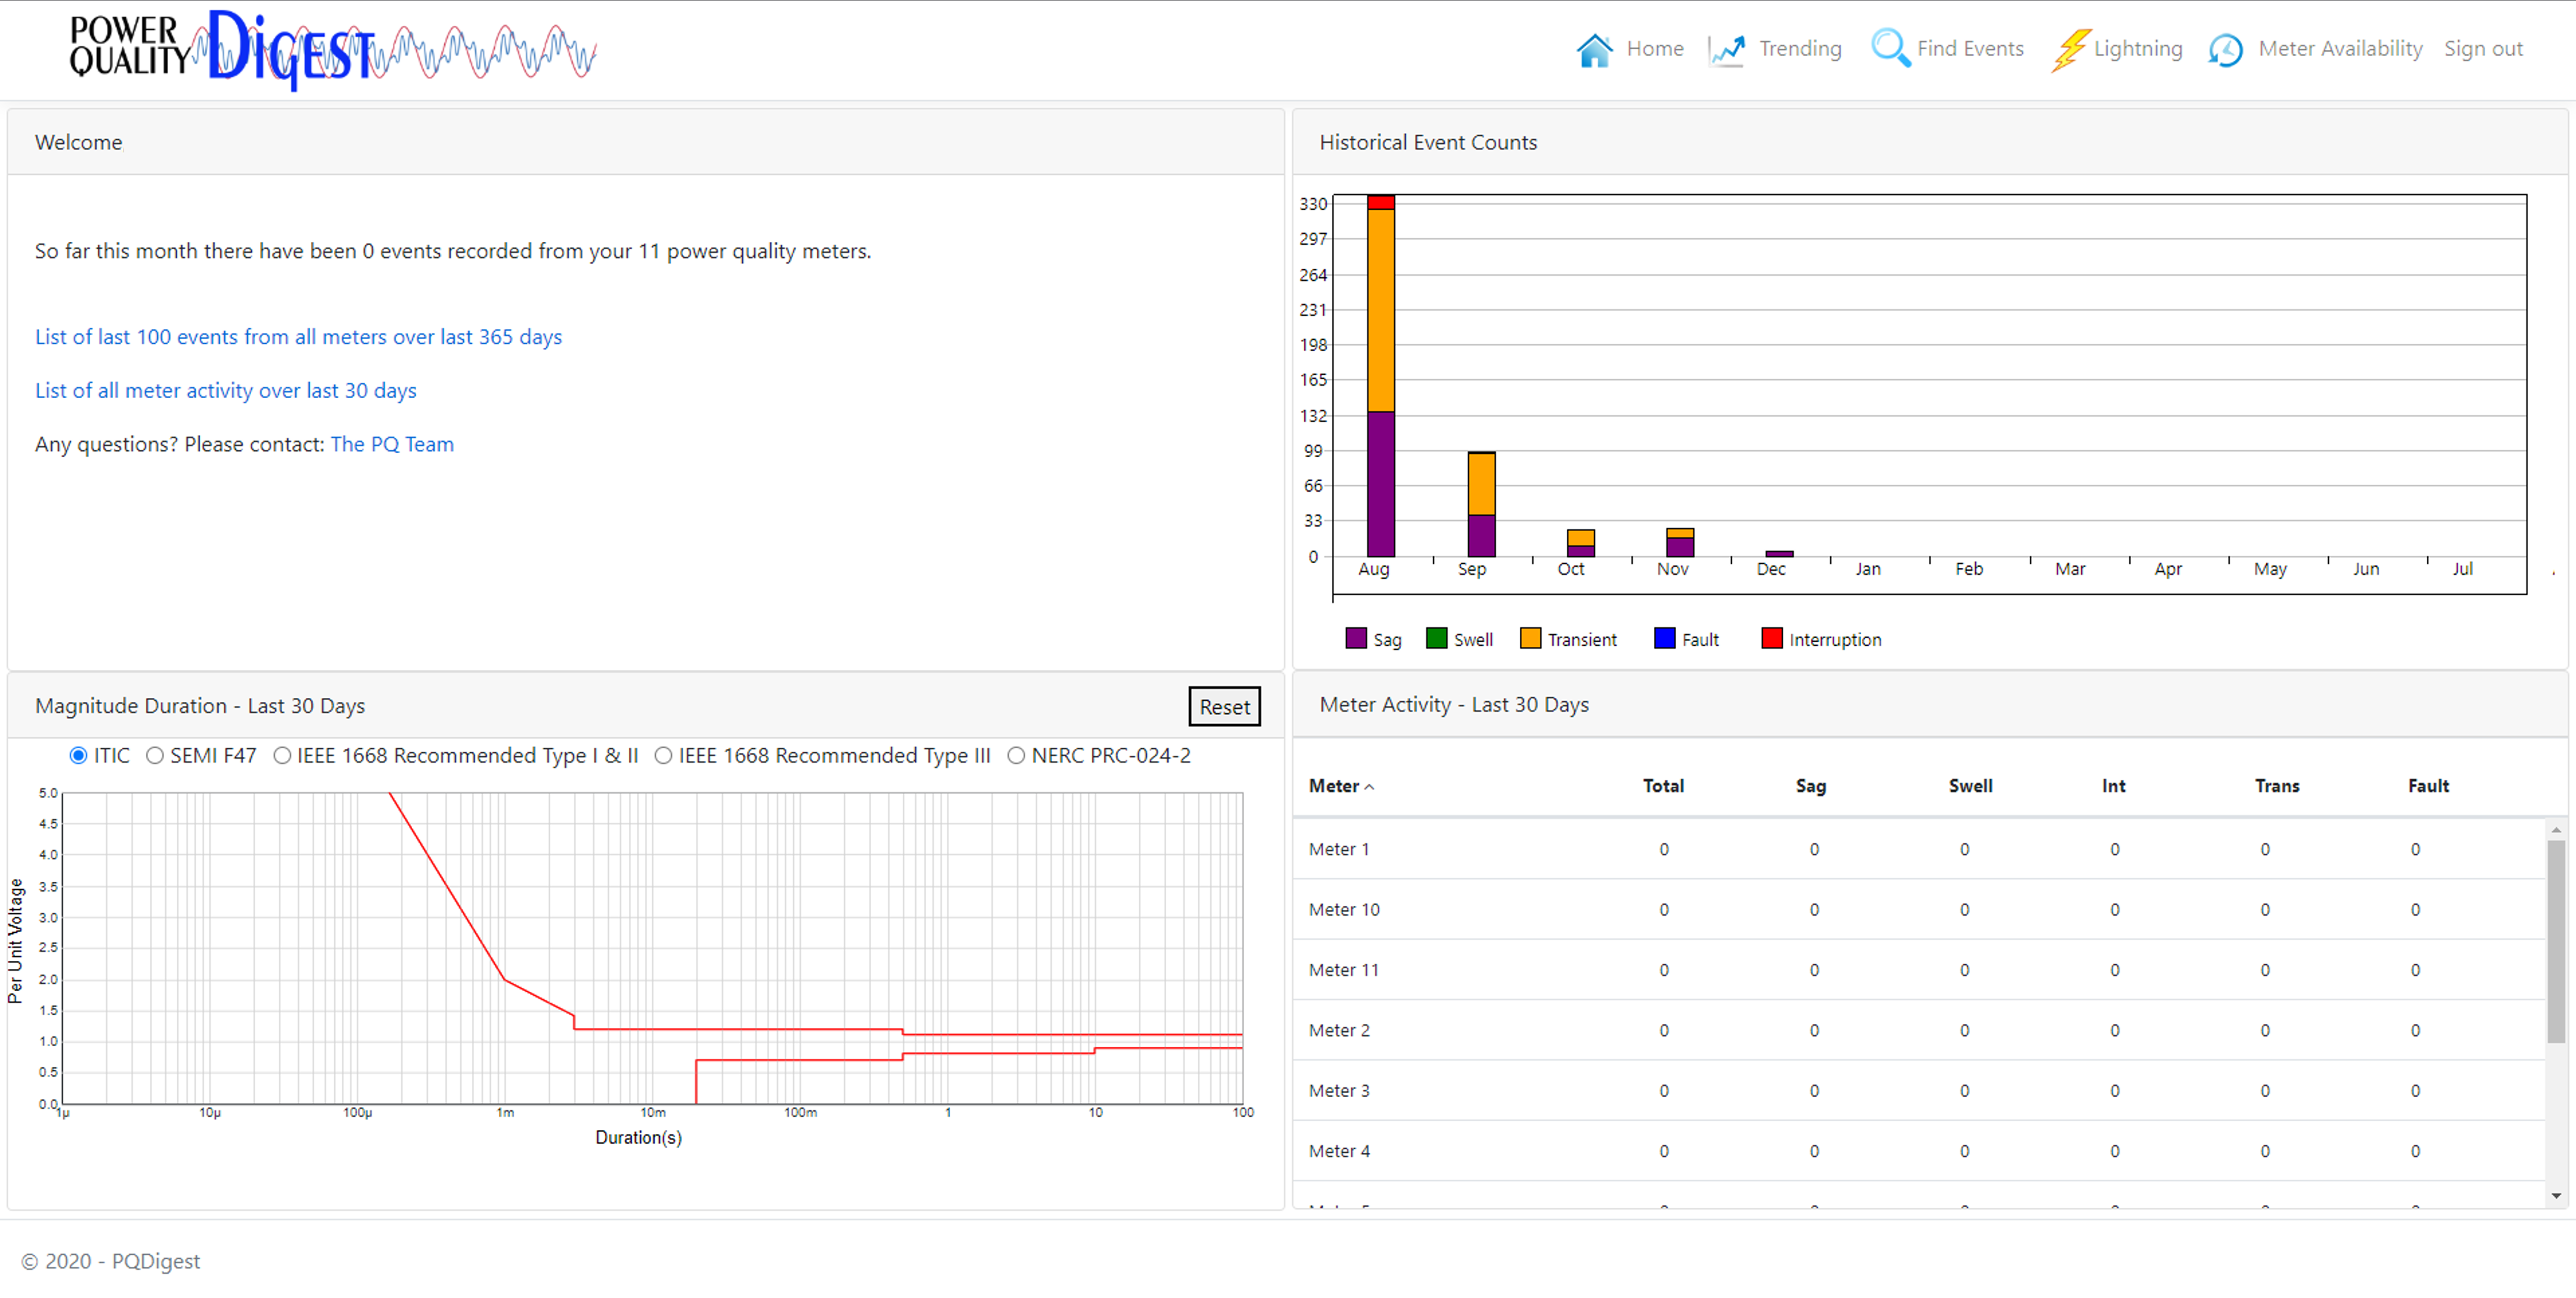
PQ Digest
PQ Digest provides a restricted view for external stakeholders with simplified summaries to avoid oversharing.